Contact/H-bond matrix#
Motivation#
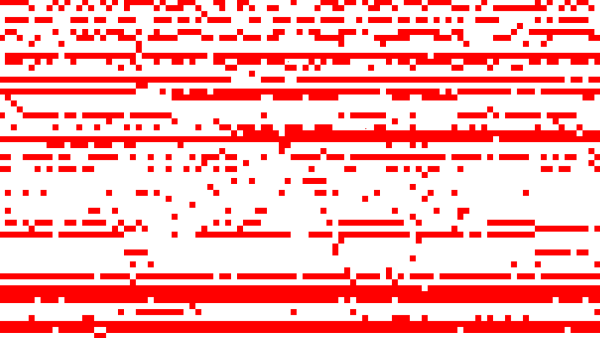
GROMACS has an excellent tool to calculate hydrogen bonds (H-bonds) or contacts from trajectories called gmx hbond. It is written in C++, and the loops are parallelized. Therefore, its performance cannot be matched by any Python code. The default output from gmx hbond is a .xvg file containing the total number of H-bonds/contacts between the selected groups over all frames, which is not very informative. The option -hbm outputs the existence matrix for all H-bonds/contacts over all frames in an X PixMap (.xpm) image:

Only a few image viewers support .xpm file format, and the image cannot be easily interpreted because it does not contain any labels for the participating atoms and residues in the H-bonds/contacts. To overcome these limitations, use MD DaVis for analyzing the output files created by gmx hbond.
Steps#
Calculate the H-bonds/contacts using
gmx hbondwith the options-hbmand-hbn:
gmx hbond -f trajectory.trr -s structure.tpr -num hbnum.xvg -hbm hb_matrix -hbn hb_index
To calculate the contacts provide --contact option. gmx hbond requires the .tpr file to be supplied to the -s option, and other structure formats like .pdb or .gro are not accepted. However, the md-davis hbond command in the next step requires a .pdb file. The first frame of the trajectory can be saved in a .pdb file as follows:
gmx trjconv -f trajectory.trr -s stucture.tpr -o structure.pdb -dump 0
The order of rows in the hb_matrix.xpm image is the same as the order of atoms in the hb_index.ndx file. MD DaVis utilizes this to determine the atoms in each H-bond/contact (rows in the .xpm file).
Create and save the H-bonds/contacts data:
md-davis hbond -f hb_matrix.xpm --index hb_index.ndx -s structure.pdb --pickle hb_data.p -g hbonds_Protein
Plot the H-bonds/contacts matrix:
md-davis plot_hbond --percent --total_frames 101 --cutoff 33 -o 2VH7_hbond_matrix.html 2VH7_hbonds.p
The above command plots the percentage of the H-bonds, which is calculated for each H-bond as follows:
number of frames the H-bond is observed / total number of frames * 100
The cutoff of 33 % is set to plot only those H-bonds whose occurrence is greater than 33 %.
Bonus Tip#
Scroll down the hb_index.ndx file to find the name of the group containing the atoms participating in H-bonds/contacts. It contains three or two columns of data for H-bonds or contacts, respectively.
 1235  1243  1244  1248  1249  1260  1261  1263  1264  1280  1285  1286  1301  1302  1320
 1321  1339  1340  1356  1361  1362  1380  1381  1389  1390  1392  1393  1410  1413  1414
 1421  1424  1425  1433  1434  1436  1437  1456  1457  1468  1469  1473  1474  1492  1493
 1508  1509  1525  1530  1531
[ hbonds_Protein ]
      9     10     35
     36     37    773
     55     56   1285
     62     63    725
     62     63    726
Hydrogen bonds (H-bonds) and contacts in a protein or between protein and ligand are calculated to understand the interactions essential for its function. GROMACS has the hbond utility to calculate the H-bonds and contacts purely from geometric considerations. By default, the command only returns the number of H-bonds/contacts detected in each frame, which is not informative enough. However, by providing suitable options to the hbond utility, an index file with the list of the atoms involved in each H-bond/contact detected and a matrix with the H-bonds/contacts can be obtained. The matrix has H-bonds/contacts listed in the index file along one dimension and the trajectory frames along the other dimension. The elements of the matrix denote the presence of a hydrogen bond at a particular frame. Unfortunately, the matrix does not have any labels, and its size becomes huge for long simulations making it uninterpretable. MD DaVis processes these files to calculate the number of frames with the H-bond/contact, which can be converted to a percentage. This can then be represented as a matrix where the participating atoms are along the two dimensions of the matrix (Figure 1D).